Employment in Machinery Manufacturing
320,000 workers were engaged in machinery manufacturing, which was a 11.0% of total amount of manufacturing business and it was ranked in the third position in 2014.
Employment rate of manufacturers of general machinery industry
| 1970 | 1980 | 1990 | 2000 | 2005 | 2010 | 2014 | |
|---|---|---|---|---|---|---|---|
| The number of trades (share,%) |
26,309 (3.1) |
81,108 (4.0) |
199,004 (6.6) |
209,127 (9.0) | 245,386 (10.0) | 282,127 (10.7) | 319,008 (11.0) |
| Compound annual growth rate (CAGR,%) | ※ General Machinery : (`70~`80) 11.9, (`80~`90) 9.4, (`90~`00) 2.3, (`00~`10) 3.0, (`10~`14) 3.5 | ||||||
- ※ (Source) STATISTICS KOREA
Number of Workers by Industry(2-digits, 5 or More WORKERS)(2007) No. of Employment, %
| CODE | Sector | Employment No. | Share | Rank |
|---|---|---|---|---|
| C | Manufacturing business(10 ~ 33) | 2,694,782 | 100 | - |
| C10 | Manufacture of Food products | 163,602 | 6.1 | 6 |
| C11 | Beverage manufacturing industry | 13,127 | 0.5 | 22 |
| C12 | Cigarette manufacturing industry | 2,274 | 0.1 | 24 |
| C13 | Textile goods manufacturing industry; except clothing | 94,103 | 3.5 | 11 |
| C14 | Clothes, accessories and fur goods manufacturing industry | 76,728 | 2.8 | 12 |
| C15 | Leather, bag and shoes manufacturing industry | 19,727 | 0.7 | 20 |
| C16 | Wood and wooden product manufacturing industry | 17,421 | 0.6 | 21 |
| C17 | Pulp, paper and pater product manufacturing industry | 50,235 | 1.9 | 15 |
| C18 | Printer and recording media reproduction service | 30,016 | 1.1 | 17 |
| C19 | Coke, coal and oil-refined products manufacturing industry | 11,312 | 0.4 | 23 |
| C20 | Chemical substances and products manufacturing industry; except drugs | 113,407 | 4.2 | 10 |
| C21 | Medical substance and drug manufacturing industry | 29,202 | 1.1 | 18 |
| C22 | Rubber and plastic goods manufacturing industry | 189,371 | 7.0 | 5 |
| C23 | Nonmetal mineral product manufacturing industry | 76,715 | 2.8 | 13 |
| C24 | Primary metal manufacturing industry | 134,320 | 5.0 | 9 |
| C25 | Metal processing products manufacturing industry; except machines and furniture | 249,392 | 9.3 | 4 |
| C26 | Electronic components, computers, audio, visual, communication device manufacturing industry | 399,714 | 14.8 | 1 |
| C27 | Medical, precision, optical instruments and clocks manufacturing industry | 68,5831 | 2.5 | 14 |
| C28 | Electrical equipment manufacturing industry | 156,253 | 5.8 | 8 |
| C29 | Other machines and devices manufacturing industry | 295,216 | 11.0 | 2 |
| C30 | Automobile and trailer manufacturing industry | 288,089 | 10.7 | 3 |
| C31 | Other transportation equipment manufacturing industry | 157,465 | 5.8 | 7 |
| C32 | Furniture manufacturing industry | 34,683 | 1.3 | 16 |
| C33 | Other products manufacturing industry | 23,827 | 0.9 | 19 |
- ※ (Source) STATISTICS KOREA
Statistics for Machinery Production and Added Value in Korea
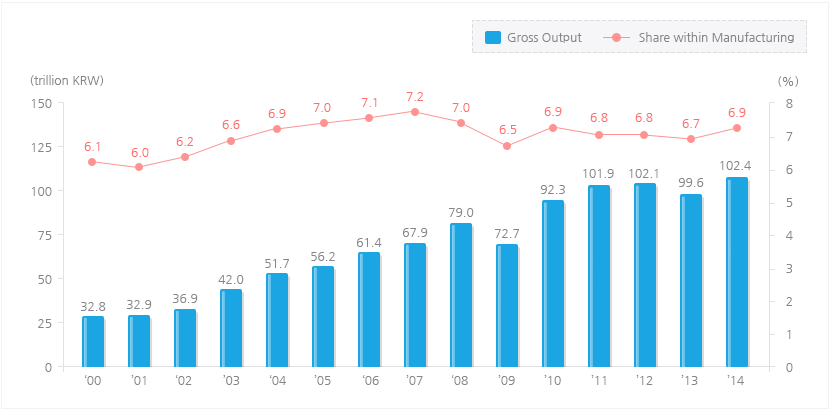
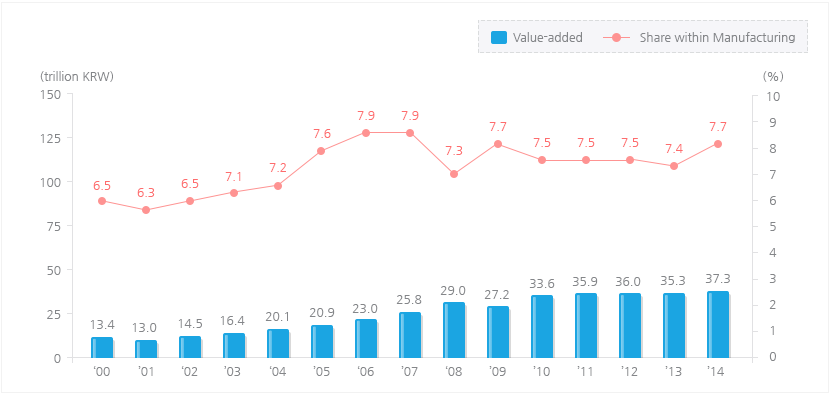
The general machinery industry showed a growth rate above the manufacturing average, leading to the growth of the Korean manufacturing industry in the 2000s.
Since 2000, the annual average growth rate of the general machinery industry has been 8.5% in production, 7.6% in value added, exceeding each manufacturing industry by 0.9% p and 0.7% p, respectively.
Since 2000, the annual average growth rate of the general machinery industry has been 8.5% in production, 7.6% in value added, exceeding each manufacturing industry by 0.9% p and 0.7% p, respectively.
The Gross Output, Value-added of General Machnery Industry*Unit : trillion KRW, %
| 2000 | 2001 | 2002 | 2003 | 2004 | 2005 | 2006 | 2009 | 2012 | 2014 | CAGR ('00~'14) |
||
|---|---|---|---|---|---|---|---|---|---|---|---|---|
| Gross Output |
Manufacturing(A) | 534.5 | 548.7 | 594.0 | 634.5 | 749.1 | 801.7 | 859.7 | 1,122 | 1,511.5 | 1,489.2 | 7.6 |
| General Machinery(B) | 32.8 | 32.9 | 36.9 | 42.0 | 51.7 | 56.2 | 61.4 | 72.7 | 102.1 | 102.4 | 8.5 | |
| (B/A) | (B/A) | (6.0) | (6.2) | (6.6) | (6.9) | (7.0) | (7.1) | (6.5) | (6.8) | (6.9) | - | |
| Value- added |
Manufacturing(A) | 205.2 | 206.6 | 224.9 | 236.8 | 281.6 | 291.2 | 304.1 | 374.5 | 480.7 | 484.5 | 6.3 |
| General Machinery(B) | 13.4 | 13.0 | 14.5 | 16.4 | 20.1 | 20.9 | 23.0 | 27.2 | 36.0 | 37.3 | 7.6 | |
| (B/A) | (6.5) | (6.3) | (6.5) | (6.9) | (7.1) | (7.2) | (7.6) | (7.3) | (7.5) | (7.7) | - |
- ※ Source : STATISTICS KOREA
(note) NO. of Employment 10 or more workers


- Source: Survey on mining and manufacturing industry by National Statistical Office (limited to companies of 10 or more employees)
Progress of General Machinery Trade
The export ratio in contrast to production of general machines dwelled at around 10% between 1970 and 1990, the early stage of domestic machinery industry, but increased to 39% in 1998 with policies to strengthen competitiveness in exports and diversify export markets for the sake of overcoming the rapid decrease in domestic consumption due to IMF. It increased to over 40% in the late 2000’s and reached about 50% in the early 2010.
Export ratio of general machinery industry

- It indicates an import of machinery increases while increasing demand in general machinery. In 2008, an import of general machinery was 43.1%, which tended to be raise; however, it has been decreasing since 2012.
Import ratio of general machinery industry

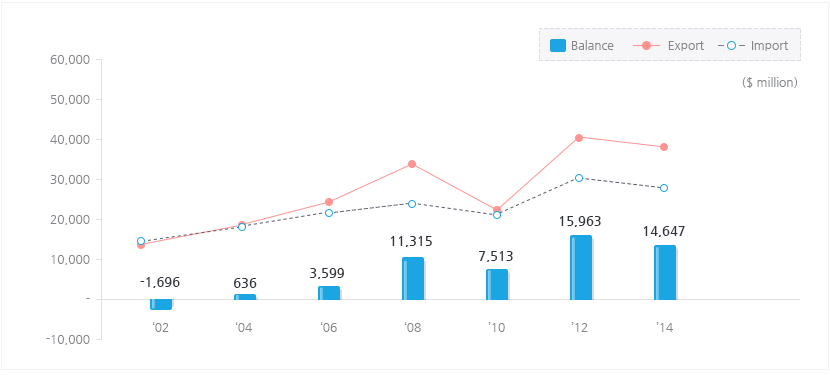
Export and Import of General Machineryunit : $ million, %
| 2002 | 2004 | 2006 | 2008 | 2010 | 2012 | 2014 | CAGR (`02~`14) |
||
|---|---|---|---|---|---|---|---|---|---|
| Export | Amount Ratio(%) |
9,256 (5.7) |
16,839 (6.6) |
23,865 (7.3) |
37,298 (8.8) |
36,103 (7.7) |
47,914 (8.7) |
48,345 (8.4) |
14.8 - |
| Import | Amount Ratio(%) |
10,951 (7.2) |
16,202 (7.2) |
20,265 (6.6) |
25,984 (6.0) |
28,591 (6.7) |
31,951 (6.1) |
33,699 (6.4) |
9.8 - |
| Trade Balance |
Amount | -1,696 | 636 | 3,599 | 11,315 | 7,513 | 15,963 | 14,647 | |

Korean General Machinery Market Share
Production
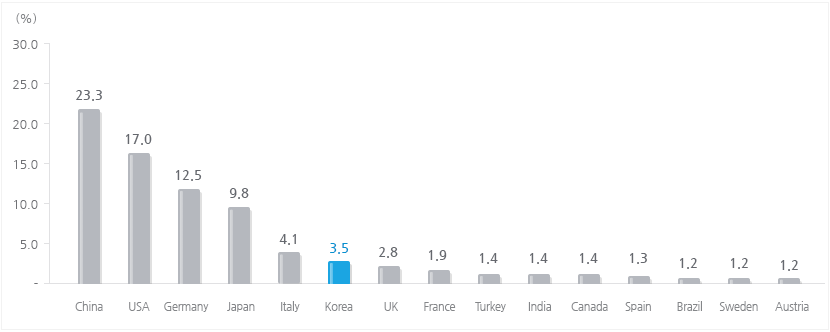
- In 2013, 15 countries took 85.9% of global general machinery production; China took the first place with 25.3% of share, followed by U.S.A (17%), Germany (12%) and Korea took the 6th place with 3.5%.
- Since 2005, Korea has remained above 8th place in terms of global general machinery production and the share increased from 2.8% to 3.5%
- After reaching at 9.1% in 2005, China took first place with 25.3% of market shares in 2013, which was more than doubled. Brazil, Russia and India has kept developing as main producers of global general machinery with inflow of foreign direct investment(FDI) of foreign enterprises, rapid growth of capital goods industry, etc.

| Rank | 1 | 2 | 3 | 4 | 5 | 6 | 7 | 8 | 9 | 10 | - |
|---|---|---|---|---|---|---|---|---|---|---|---|
| 2005 | USA | Japan | Germany | China | Italy | UK | France | Korea | Canada | Spain | sub-total |
| Share | 20.1 | 18.6 | 13.4 | 9.1 | 6.4 | 3.5 | 3.1 | 2.8 | 1.7 | 1.5 | 80.2 |
| 2010 | China | USA | Germany | Japan | Italy | UK | France | Korea | Canada | Brazil | sub-total |
| Share | 25.3 | 17.0 | 12.5 | 9.8 | 4.1 | 3.5 | 2.8 | 1.9 | 1.4 | 1.4 | 79.7 |
- ※ Source : UN, [International Yearbook of Industrial Statistics 2012]
Export
- : In 2014, top five countries took over 50% of global general machinery export market; No.1 export nation was Germany (14.8%), followed by China (11.3%), the U.S. (11.3%), Japan (7.8%), Italy (6.7%) and Korea took the 8th place with 3.2%.
Import
- In 2014, top ten countries took over 50% of global general machinery import market; No.1 import nation was the U.S. (14.1%), followed by China (8.1%), Germany (7.2%), the UK (4.0%), France (3.8%), Canada (3.7%), Mexico (3.3%), Russia (2.9%) and Korea (2.6%).
| Rank | 1 | 2 | 3 | 4 | 5 | 6 | 7 | 8 | 9 | 10 | - | |
|---|---|---|---|---|---|---|---|---|---|---|---|---|
| EX | Country | Germany | China | USA | Japan | Italy | UK | France | Korea | Netherlands | Singapore | sub-total |
| Share | 14.8 | 11.8 | 11.3 | 7.8 | 6.7 | 4.2 | 4.0 | 3.2 | 3.1 | 2.2 | 69.1 | |
| IM | Country | USA | China | Germany | UK | France | Canada | Mexico | Russia | Japan | Korea | sub-total |
| Share | 14.1 | 8.1 | 7.2 | 4.0 | 3.8 | 3.7 | 3.3 | 2.9 | 2.7 | 2.6 | 52.3 |
- ※ Source : UN Comtrade
